Showing posts with label Data. Show all posts

Monday, March 23, 2015

Who had health insurance coverage pre-2014?

by Lecia Parks Langston, Senior Economist

Recent tax filers undoubtedly noticed something new on their 2014 federal tax form. For the first time, the “shared responsibility” provision of the Affordable Care Act required individuals to have qualifying health coverage, qualify for a coverage exemption, or make a shared responsibility payment when filing tax returns. The U.S. Census Bureau’s recently released health insurance (2008-2013) estimates provide a baseline of health insurance coverage before the Affordable Care Act individual shared responsibility requirements. In future years, the effects of the Affordable Care Act will be apparent in this data series.

This data is based on modeled American Community Survey estimates and administrative data. It allows analysis of differences in coverage by demographics at the county level. In addition to statewide data, the following visualization provides an interactive method to view coverage at the county level.
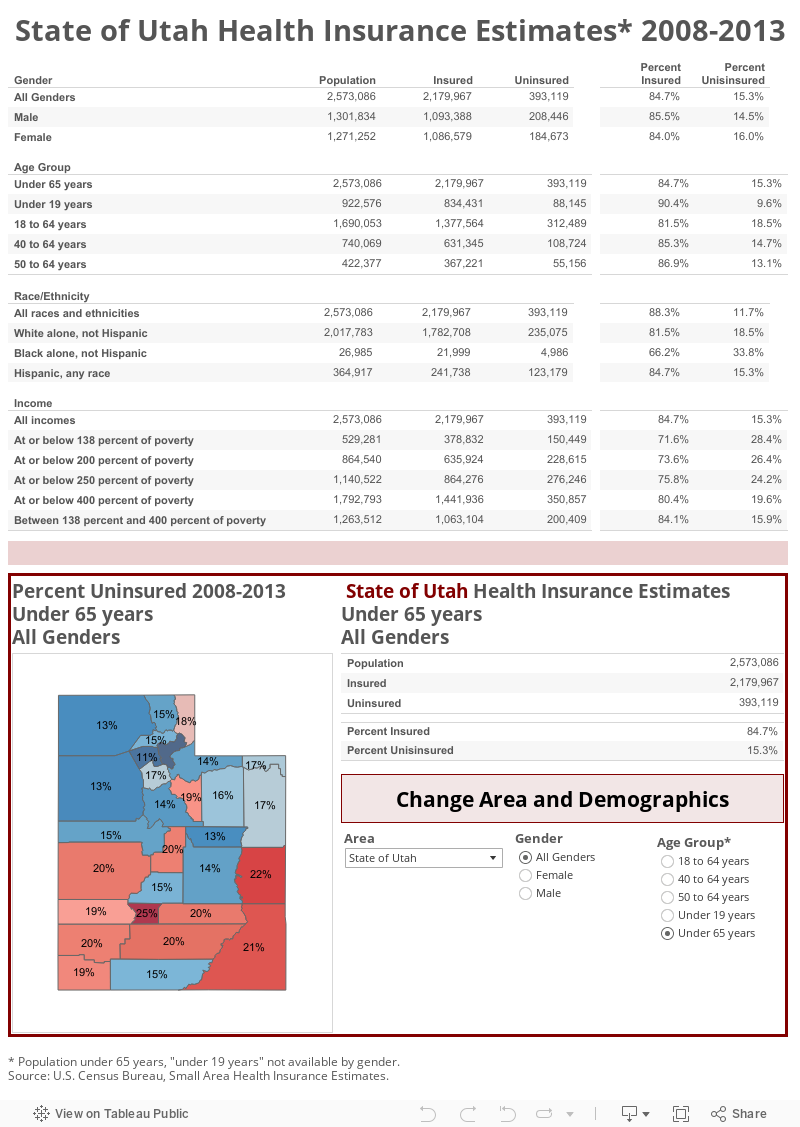

Keep in mind that government-provided healthcare coverage (such as Medicaid) is included. What do these figures tell us about health insurance coverage for Utahns under the age of 65 prior to 2014?

• Roughly 15 percent of Utah’s population under age 65 did not have health insurance between 2008 and 2013.

• Utah women were slightly less likely (84 percent) than Utah men (86 percent) to maintain healthcare coverage.

• Young people under the age of 19 were most likely to be covered by health insurance. More than 90 percent had coverage.

• Of the reported racial/ethnic groups, Hispanics showed the highest rates of healthcare coverage.

• In Utah, the lower incomes translated into lower shares of insured individuals.

• In general, Utah counties in the southern half of the state showed the highest shares of uninsured.

• Piute County’s estimate indicates that one-fourth of its population did not maintain healthcare coverage, the highest uninsured rate in Utah.

• Morgan County showed the highest percentage of insured individuals (90 percent).

Friday, August 29, 2014

A Story of Wage Data

The Wages and Income page has a new look to the wage data that is gathered by the Workforce Research and Analysis division. Along with visualization of the data, you can now read story points at the top of each graph, to help understand what the data is showing you along with highlighting its insights. Just click along the story points at the top of the visualization to follow the story of wages.


Friday, February 28, 2014

Friday, October 11, 2013

Utah Department of Workforce Services “Top” Jobs

Get a dynamic view of the occupations with the largest number of openings. Data is provided by job orders that have been placed with the Utah Department of Workforce Services.

DWS openings show data collected from June 2012 to the current quarter of data and can be seen in state, sub-state and individual counties. Selecting major occupational groups will show more detailed occupations and selecting occupations will show openings by selected area.

See the full version here.

Monday, September 23, 2013

Unemployment Insurance Weekly Claims Report

The latest Unemployment Insurance (UI) Weekly Claims Report is now available from the US Department of Labor. The four-week moving average of nationwide initial claims has decreased from the revised number of 321,750 last week to 314,750 this week. 

The report dated 19 September 2013 reflects our unemployment numbers for week-ending 7 September 2013. During this week, 1,678 initial claims were filed in Utah compared to 1,402 the prior week. The numbers listed below are based on the four-week moving average.
  • 1,556 initial UI claims filed (increase of 56 from the prior week and decrease of 56 from same week in 2012).
  • 12,751 continued UI weeks claimed (decrease of 174 from the prior week and decrease of 738 from same week in 2012).
  • 2,643 continued EUC08 weeks claimed (decrease of 23 from the prior week and decrease of 2,473 from the same week in 2012).

Thursday, September 19, 2013

First round of 2012 American Community Survey results released

The U.S. Census Bureau has just released the first round of data from the 2012 American Community Survey (ACS). This survey is the primary source of demographic, income and poverty data for the United States. It covers more than 40 topics ranging from language spoken at home to selected monthly homeowner costs.

As usual, these figures can be accessed from the American FactFinder. To learn more about ACS, see a previous post written about an article by Jim Robson in a past issue of Trendlines.We’ll publish interesting facts from the ACS data in upcoming posts. The current release includes figures for the nation, states, Metropolitan Statistical Areas (MSAs) and counties/places with population of 65,000 or more. A list of the Utah areas follows after the jump.


  • Cache County
  • Davis County
  • Salt Lake County
  • Utah County
  • Washington County
  • Weber County
  • Layton
  • Millcreek CDP
  • Ogden
  • Orem
  • Provo
  • St. George
  • Salt Lake City
  • Sandy
  • West Jordan
  • West Valley

Wednesday, September 4, 2013

National and local industry web tools

All of the industry data that the Department of Workforce Services collects has a NAICS (North American Industry Classification System) code; a standardized coding system used by the United States, Canada and Mexico, that provides consistency and comparison between industries. An industry (as opposed to occupation) represents businesses providing or producing the same products or services. NAICS divides industries into 20 sectors, coding each industry with up-to a 6-digit number, making it easy to look at industry data for the entire North American continent.


The U.S. Census Bureau has launched a new web tool called the Industry Statistics Portal. This new web application provides easy access to all Census Bureau programs that release statistics for a user-selected industry, as classified by the North American Industry Classification System.

The Department of Workforce Services has two online tools for industry that are specific to Utah. FirmFind allows you to find employers based on their industry. Information is available for specific county, groups of counties, or for the entire State. Industry employment and wage data is collected through the Quarterly Census of Employment and Wages (QCEW) program. The primary source for QCEW data are the reports submitted by employers to the Utah Unemployment Insurance program.

For an entire list of DWS’ online data tools, visit the Utah Economic Data Viewer (UEDV).

Friday, August 30, 2013

Census Bureau Releases Health Insurance Coverage Estimates for All Counties

The Census Bureau today released its 2011 Small Area Health Insurance Estimates (SAHIE). The estimates show the number of people with and without health insurance for all states and each of the nation’s roughly 3,140 counties. The statistics are provided by broad age group, sex, race and Hispanic origin, and at income levels that reflect thresholds for state and federal assistance programs. The data can be used to assess annual changes in health insurance coverage from 2008 through 2011.

The release includes a 2011 highlights document that describes demographic and economic differences in health insurance status across states and counties, as well as geographic variation and time trends in health insurance status. The document also includes a number of maps that are available for download from the SAHIE website.

SAHIE can be a useful tool when evaluating the impacts of health care policy changes at the state and county levels. SAHIE provides estimates of the uninsured at incomes 0 to 138 percent of the federal poverty threshold. This group may qualify for Medicaid in participating states. The 0 to 400 percent group provides estimates of the uninsured population that may qualify for the Health Insurance Exchanges or for Medicaid. To make quick evaluations of your state’s potential program participants, visit the SAHIE interactive data and mapping tool on the SAHIE website. The tool allows users to create and download state and county custom tables and thematic maps, and state health insurance coverage time trend charts. U.S. Census Bureau

Related post: Utah's Labor Market and Economy Blog

Wednesday, August 28, 2013

Youngest in the nation

It’s no secret to Utah’s demographers: Utah maintains the youngest population in the United States. (I once heard it said that you have a greater probability of being rundown by a stroller in Utah than in any other state in the nation.) Higher-than-average fertility and birth rates contribute to Utah’s lowest-in-the-nation median age—29.6 years. Compare that figure to the nationwide median age of 37.3 years. Yes, we really are young.

The state’s relative youth was highlighted recently in CNN Money’s list of “25 Youngest Best Places to Live in America.” Of the 25 smaller towns listed, four are from Utah. Interestingly enough, all four are within the borders of Utah County.

Rank 1     Eagle Mountain; median age 19.9 years
Rank 11   Highland; median age 22.4 years
Rank 12   Saratoga Springs; median age 22.6 years
Rank 15   Cedar Hills; median age 23.2 years

Click to Enlarge
Utah’s relative youth brings both economic advantages and disadvantages. Of course, educating so many children entails no small expense. However, Utah’s young (and, can we say vibrant) labor force remains attractive to employers and helps to keep Utah’s economy a step ahead of many others. (To paraphrase Field of Dreams, “If you train them, jobs will come.”)

Tuesday, August 27, 2013

Utah Farmland Values Up 5.6 Percent in 2013

Average farm real estate values, a measurement of the value of all land and buildings on farms, in Utah at $1,900 per acre was up 5.6 percent compared to 2012, according to the National Agricultural Statistics Service, Utah Field Office.

Cropland in Utah averaged a value of $2,820 per acre in 2013, an increase of 4.8 percent from 2012. Irrigated cropland in the State was valued at an average of $5,200 per acre, up 4 percent from 2012 while non-irrigated cropland was valued at an average of $1,100 per acre, a rise of 6.8 percent from the year before.

Utah pasture land in 2013 was valued at an average of $950 per acre, an increase of 3.3 percent from 2012. USDA

For a look at the more detailed report and comparisons with the rest of the nation, see here.

Monday, August 19, 2013

Local Employment Dynamics (LED) data illuminates effects of recession and recovery

The Council for Community and Economic Research provides a monthly webinar series to help connect economic development experts and labor market information analysts with timely information on trending topics, new resources, and best practices.

After reading an article in a past issue of Trendlines, the United States Census Bureau invited DWS Regional Economist Lecia Parks Langston to present to the nation on Wednesday, August 21st, about Local Employment Dynamics (LED) data, and how it can be used for detailed analysis of local economies and industries over the business cycle.

This webinar is free to the public and can be signed up here.

Thursday, August 15, 2013

Back to School

As part of its “Facts for Features” series, the U.S. Census Bureau regularly provides interesting data tidbits for special dates and occasions. They just recently released their “Back to School” statistics.

This week, public-school students in Washington County return to classrooms from summer vacation. So, the timing seems right to cover a few interesting statistics on education in Utah. . .


From the Utah State Office of Education:

In the 2011-2012 school year, white non-Hispanic students comprised 88 percent of total public school students. Hispanic/Latino students accounted for another 16 percent of students.
  •  
  •  Utah public schools maintained 555 elementary schools, 170 middle/junior high schools and 136 high schools in 2011-2012.
  • More than 26,000 licensed classroom teachers provided education to Utah students in public schools.
  • Utah’s public-school pupil-teacher ratio measured 22 students compared to 16 students nationwide.
  • In October 2012, roughly 601,000 students were enrolled in public schools; 50,800 of those students attended charter schools. 

From the Utah Department of Workforce Services: 

  •  In 2012, more almost 38,000 workers were employed in private educational services. An additional 66,800 employees worked in public education and another 39,100 individuals worked in public higher education.
  • Payroll for educational services (public and private) totaled more than $4.7 billion.
  • The median wages for school teachers in Utah are as follows: $47,800 for elementary school teachers, $50,400 for secondary school teachers and $50,800 for middle school teachers.
  • Projected average annual openings for school teachers in Utah equals almost 1,200 per year (includes new jobs and turnover). 

From the American Community Survey:
  • In 2011, 90 percent of the Utah population over the age of 25 had a high school diploma; almost 30 percent had a bachelor’s degree or higher.
  • Approximately 259,000 Utahns were enrolled in college or graduate/professional schools in 2011.
  • Roughly 13 percent of the 2011 Utah population 18 years and older was enrolled in college or graduate school.
  • About 4 percent of the population 35 years and older were enrolled in some type of schooling.
  • Roughly 15 percent of Utah school-age children (5-17 years) spoke a language other than English at home.
  • In 2011, Utah the median earnings for workers with a bachelor’s degree measured $14,400 than the median earnings for workers with just a high school education.

Wednesday, July 31, 2013

Why we're working less than our parents did

As a whole, Americans are working far less now than they did a generation ago, and have more leisure time than ever.

The average work week has gone from over 38 hours in 1964 to under 34 hours in 2013 -- a drop of nearly 12%, according to the Bureau of Labor Statistics.

A big reason for the decline is the growth in part-time jobs, which have surged as more women entered the workforce and the number of restaurants, shopping malls, and other establishments that employ part-time workers have exploded.


Another explanation is that people tend to stay in school longer and retire earlier, clocking fewer hours over their lifetime. Men in their 50s, for example, have been retiring or entering semi-retirement earlier and in greater numbers than those in previous generations, according to John Robinson, a sociology professor at the University of Maryland, and are partly responsible for driving down overall work hours per week.

Coinciding with the shorter work week is a rise in leisure time. Americans reported having just under 35 hours a week of "free time" in 1965 -- that's time not spent at work, doing housework, eating, sleeping or doing other activities necessary for day-to-day survival, according to research by Robinson, who directs the American's Use of Time Project at the University of Maryland.

By 2012, it had reached 42, according to the Bureau of Labor Statistics.

Some people, especially those at the higher end of the earnings spectrum, report working more hours than they want to. This is particularly true for professionals who are now tied to their work by smartphones and email.

Also, many Americans are working part time not because they want to, but because their jobs have been replaced by automation, outsourced, or otherwise eliminated. CNN

Monday, July 22, 2013

The rise of the intangible economy: U.S. GDP counts R&D, artistic creation

On July 31, the U.S. Bureau of Economic Analysis will rewrite history on a grand scale by restating the size and composition of the gross domestic product, all the way back to the first year it was recorded, 1929. The biggest change will be the reclassification—nay, the elevation—of research and development. R&D will no longer be treated as a mere expense, like the electricity bill or food for the company cafeteria. It will be categorized on the government’s books as an investment, akin to constructing a factory or digging a mine. In another victory for intellectual property, original works of art such as films, music, and books will be treated for the first time as long-lived assets.

The BEA has the 20th century economy down cold. It can tell you about personal income trends in Anchorage, Alaska, or America’s annual output of rubber products and plastics. Now the agency is putting more attention on R&D—the lifeblood of the 21st century economy—by moving it from an experimental “satellite” account into the heart of measured GDP.


GDP is the main yardstick of macroeconomics—the sum total of all goods and services produced in the country. Business R&D was never counted in that total. It was considered an expense, an “intermediate input,” that ate into profit. Intangible investments such as R&D and the creation of artistic originals have been like physicists’ dark matter: influential but invisible. As Federal Reserve Chairman Ben Bernanke said in a 2011 speech, “We will be more likely to promote innovative activity if we are able to measure it more effectively and document its role in economic growth.”

The effect of the revision will be immediate. Measured GDP will get a one-time boost of about 2.7 percent when the government starts counting R&D and artistic creation as investments. (New Mexico and Maryland will get the biggest lifts.) The future growth rate will probably be fractionally higher, too. With R&D treated as an investment, measured economic growth from 1959 to 2007 would have been 3.39 percent annually instead of 3.32 percent, the BEA estimates. Bloomberg Businessweek

Friday, July 19, 2013

Wages have fallen the most in low‐paying jobs, study says

Workers in low-wage jobs have lost a greater share of their take-home pay during the recession than higher-wage workers, according to a recent study of data from the bureau of labor statistics conducted by the National Employment Law Project, an advocacy group for low-income workers.

The study found that wages dropped over all occupations by 2.8 percent between 2009 and 2012, despite the fact that productivity increased by 4.5 percent over the same time period. But while wages in the highest income jobs only declined by less than 2 percent, wages fell 5 percent or more in five of the largest low-wage job categories: restaurant cooks, food preparation workers, home health aides, personal care aides, and maids and housekeepers.

The data is particularly relevant because the greatest number of jobs being added to the economy are in the same exact sectors where wages have decreased the most. A 2012 NELP study analyzing data from the Current Population Survey found that during the recession, the largest concentration of employment losses were in middle-wage jobs like electricians, truck drivers and administrative assistants. However, during the recovery, the biggest job gains have been in low-wage service occupations like retail salespersons, waiters and food preparers.

That study found that while mid-wage jobs accounted for 60 percent of the jobs lost in the recession, they made up only 22 percent of the recovery. In contrast, low-wage jobs were 21 percent of recession losses, but comprised 58 percent of recovery growth. Deseret News

Wednesday, July 17, 2013

Utah’s part‐time employment rate returning to historic highs

Utah has one of the highest ratios of part-time to full-time employment in the country. In 2012, almost one in four (24.7 percent) employed Utahns worked 35 hours or less, according to the Department of Workforce Services. That’s roughly 327,000 people out of a total of about 1.33 million employed workers. By contrast, 19.4 percent (one in five) of all people with jobs in the U.S. were part-timers last year.

The percentage of Utahns employed in part-time jobs has come up sharply since 2007, when the figure was 20 percent and the Great Recession was about to start. Experts are trying to understand why the ratio of full to part-time employment has narrowed so much since then, and what it means. On the surface, it looks like the vaunted jobs recovery that’s taken place in Utah since the recession ended isn’t as stellar as everyone from Gov. Gary Herbert to the media have portrayed it.

But James Robson, an economist at the Workforce Services department, notes that the 2012 figure isn’t high by historical standards. As recently as 2004, the percentage was 25.4 percent, and the average since 2000 is 23.4 percent.


What’s more, the 2007 figure was the lowest percentage since at least 1997.

Robson said Utah’s unique demographic makeup is probably behind the large percentage of Utah’s employed labor force who work part-time. It may also account for the large gap between Utah and U.S. part-time employment rates, he said.

"We do have the youngest population in the country. Part of that gap [between Utah and the U.S.] would be explained by teens in the labor force. Between the ages of 16 and 24, we have many more young people who would tend to have part-time jobs," he said.

Robson extends that thinking a step further. At 3.1 people, the average size of a Utah household is the largest in the nation. With lots of children at home, many Utah women have a "propensity" to seek part-time employment, he said. Slightly more than one in three (35 percent) working Utah women has a part-time job. By contrast, across the U.S., 26 percent work less than 35 hours.

Natalie Gochnour, the Salt Lake Chamber’s chief economist and associate dean of the University of Utah’s business school, said the cost of supporting Utah’s large family sizes "requires" many mothers to work outside their homes. Salt Lake Tribune

Wednesday, July 3, 2013

Robert Half Survey reveals retention is Executives' main staffing concern

As difficult as it has become to locate top performers, keeping them on board is proving to be an even greater worry for employers, a recent Robert Half survey shows. Nearly four in 10 (38 percent) chief financial officers (CFOs) interviewed said retaining valuable employees is their biggest staffing concern for the next 12 months. Twenty-seven percent of respondents said their top focus will be maintaining employee productivity.

The survey was developed by Robert Half, the world's first and largest specialized staffing firm, and conducted by an independent research firm. It is based on interviews with more than 2,100 CFOs from a stratified random sample of companies in more than 20 of the largest U.S. markets.

CFOs were asked, "Which one of the following is your greatest staffing concern in the next 12 months?" Their responses:

To read more including five tips for retaining key employees, click here.

Tuesday, July 2, 2013

Real Personal Income for States and Metropolitan Areas, 2007‐2011

Click to enlarge
The U.S. Bureau of Economic Analysis released experimental real, or inflation-adjusted, estimates of personal income for states and metropolitan areas. The inflation-adjustments are based in part on regional price parities (RPPs) that provide a measure of differences in price levels across each state and region relative to the national price level for each of the years, 2007-2011. When RPPs are applied in conjunction with BEA’s national Personal Consumption Expenditures (PCE) price index, which measures price changes over time, personal income comparisons can be made across regions and time periods. These prototype statistics are being released for evaluation and comment by data users. Bureau of Economic Analysis

Monday, July 1, 2013

Weak Utah job growth not cooling things off yet

Utah’s unemployment rate continued to drift lower in May, but the rate at which employers created jobs slowed notably as the effects of federal sequestration continued to kick in.

The statewide jobless rate fell to 4.6 percent last month from 4.7 percent in April, the state Department of Workforce Services said Friday, June 21st. The rate is at its lowest level this year and has been under 5 percent since February.

Carrie Mayne, the Workforce Services department’s top economist, focuses on long-term patterns. Utah’s economy has vigorously outpaced the rest of the country since the Great Recession ended four years ago, so it’s not possible to conclude much from one month of slower job growth, she said.

Of the 11 job sectors that make up Utah’s economy, only government showed real weakness.
Led mostly by federal and state agencies, that sector shed 5,200 jobs from May 2012 to last month. Federal employment fell 1.9 percent, with the steepest declines in defense-related jobs. State employment dropped 5.1 percent, mainly because the spring semester at Utah’s public colleges and universities ended in a week that was later than last year when classes were still in session.

With the exception of mining, which hasn’t added or subtracted jobs in the past year, more people are at work in all remaining nine sectors of the economy. The biggest gainer was in trade, transportation and utilities. Employment in that sector expanded by 10,900 jobs. Professional and business services was second, with 7,400 new jobs. Salt Lake Tribune

Utah tech industry grew from 2011‐12, despite decreases in clean tech

Utah’s technology industry — businesses classified by the U.S. Census Bureau as part of either the IT industry or clean tech industry — grew by 2.4 percent from September 2011 to September 2012. That’s according to data released last week by the Utah Department of Workforce Services (DWS) and compiled by the Utah Technology Council.

The total number of Utah-based businesses classified by the U.S. Census Bureau as part of the IT industry increased from 4,020 to 4,201 in that period. Meanwhile, the number of businesses in the clean tech industry decreased from 616 to 544. The increase in IT companies was enough to make up for that decrease and result in a total increase of 109 companies.

The most significant gains came in data processing, hosting and related services, which grew by just over 130 percent, increasing from 93 companies to 216. Internet publishing and broadcasting and web search portal companies increased by nearly 80 percent, from 93 to 167, and the “other information services” category grew by 115 percent, from 26 companies to 56.

The most significant decreases came in the category “regulation and administration of communications, electric, gas and other utilities,” which decreased by 82 percent, from 51 companies to nine. Administration of air and water resource and solid waste management programs went from 42 to 17 companies, a decrease of about 60 percent. Utah Business